Energy management for universities & education

A campus is a small city: dozens of buildings, shifting schedules, and nobody switching off what stays on. Building-level measurement turns the campus bill into an actionable map — and a living sustainability lab for students.

The pains we hear

Sound familiar?

Buildings without individual metering

One bill for the whole campus hides which buildings waste.

Academic schedules vs. real consumption

Air-conditioned classrooms with no classes, labs running through holidays: classic campus waste.

Education budgets under pressure

Energy competes with scholarships, salaries and labs.

Sustainability goals without data

Institutional commitments nobody can measure today.

What we measure
  • Consumption per building and faculty, comparable campus-wide
  • Classroom HVAC vs. the real academic calendar
  • Holiday, weekend and overnight consumption
  • Labs and data centers: special loads monitored
  • Data open to the classroom: measurement as a teaching tool

Campus consumption becomes a per-building KPI — and an academic resource for engineering and sustainability programs.

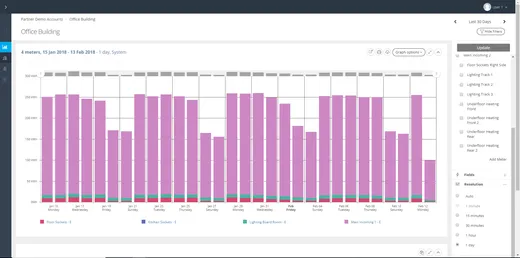
Eniscope Analytics platform dashboard
−30%

Bethune-Cookman University (Florida, USA): within 4 weeks, Eniscope diagnosed a nighttime chiller-system shutdown that had gone undetected for 5 years — fixing it cost nothing and generated savings of over 30% per month in that building. A published Best.Energy network case.

Best.Energy network · Education
Sector FAQ

Before you ask

Can a large campus be measured in phases?

Yes, and it is the recommended path: start with the highest-consuming buildings, prove the savings, scale with those results.

Can students use the data?

Yes. Per-building views feed engineering, sustainability and data science projects — the measurement pays twice.

Measure before you invest a dollar

Start with the free bill review and know within days whether you are paying removable surcharges.